Eclipsing Binary Star System: V1053 Her
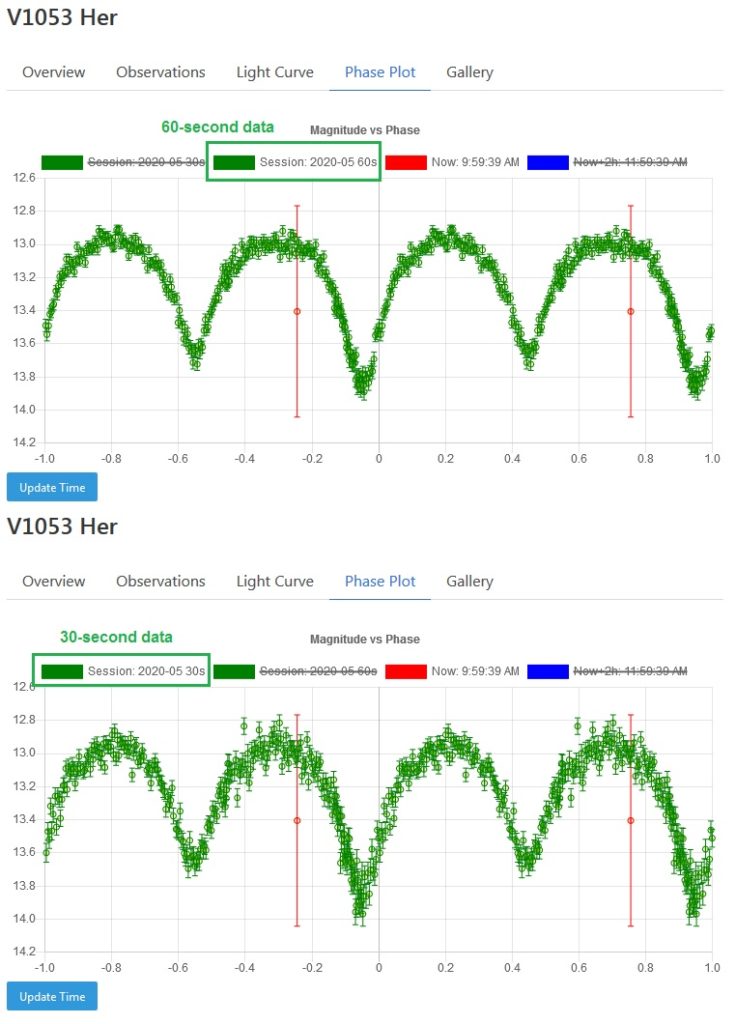
V1053 in Hercules is 13th magnitude that varies around 0.9 magnitudes from crest to trough. One of my goals was to determine a minimum exposure needed to produce satisfactory results. Satisfactory is subjective but for now I think that the “60-second data” is acceptable.

When I captured the image files I alternated between a 60-second exposure and a 30-second exposure for the entire 6.9-hour period. Due to my east-facing only imaging window I had to break it up into three sessions: May 14, 21, and 22. Afterwards I used AstroImageJ to calibrate and align the images, and then to perform differential photometry against a known constant-brightness star. If one were to look at the light curve taken by professionals you would see a noise-free sinusoidal pattern. Unfortunately the equipment required to reproduce such exceptional results are beyond my means. Instead I must settle for a certain degree of noise.
Notice that the 60-second plot (the top one) is less noisy than the 30-second plot (the bottom one). Furthermore, notice that there are outliers in the 30-second data, about an inch to the left of the red vertical “cursor”. This was part of the last session on May 22. The session started with the Sun only 16 degrees below the horizon, technically astronomical twilight, but true darkness arrived only 15 minutes later. The session lasted nearly 3 hours but notice how the outliers persisted for nearly half the session. My theory is that the atmosphere was “boiling” with turbulence. The interesting thing is this: notice how the outliers don’t exist in the 60-second data set. Here my theory is that doubling the exposure “averaged out” the negative effects of the turbulent atmosphere. I wonder if this has implications for conventional astrophotography? I’ll have to experiment with stacking two adjacent 30-second frames to see if it mitigates it.
One other interesting aspect to the light curve is that the “primary minimum” does not occur at exactly Phase: 0. I had a theory about this but then I researched it online and discovered that this is indicative of the existence of a large dark body that is perturbing the orbits of the stars: an Exoplanet!
Here is my new website that I developed for sharing my work with variable stars. The charts are fully interactive.