Category: Nebulae

Tadpole Nebula (IC 410)

Tadpole Nebula (IC 410)

These past few months I developed an interest in narrowband imaging mostly out of necessity due to the Moon. It turns out to be more challenging than I thought. One of my heroines in the field is Sara Wager. I recommend her website for anyone seeking to discover the secrets to good narrowband imaging. I’d like to share some with you:

Stretch your stacks before combining. You may notice that imaging in Hydrogen Alpha (Ha) is easy due to the strength of the signal. Oxygen III (OIII), on the other hand, is relatively weak. To prevent Ha domination you should stretch your OIII stack before combining them into a single RGB image. By how much? It all depends, so experimentation is the key.

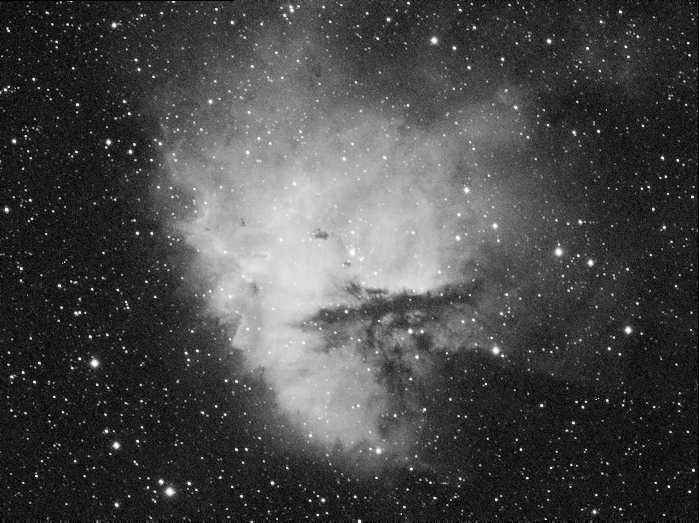
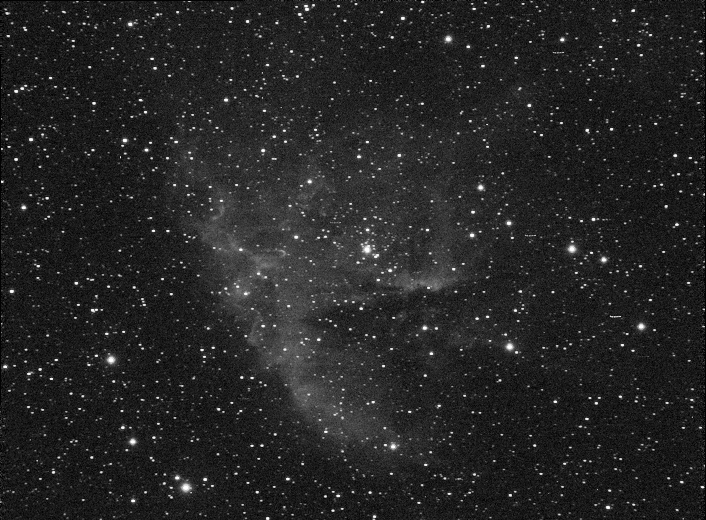
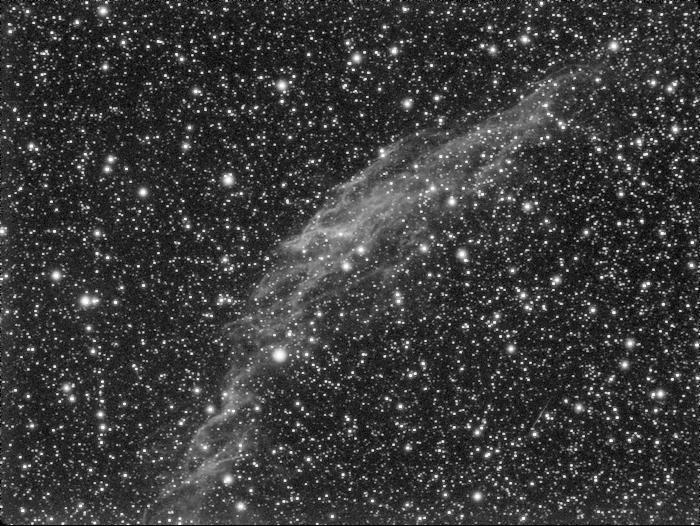
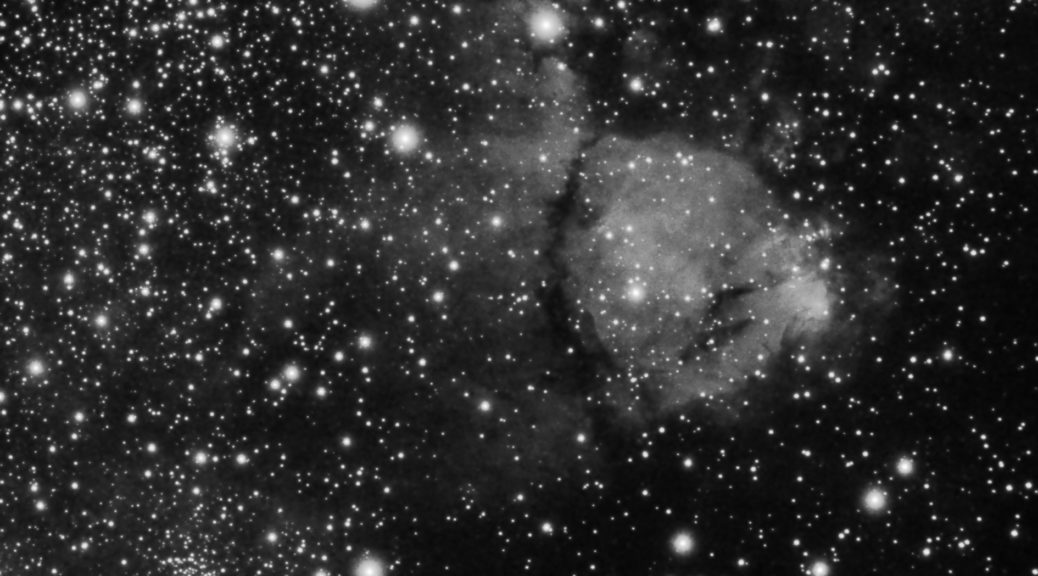
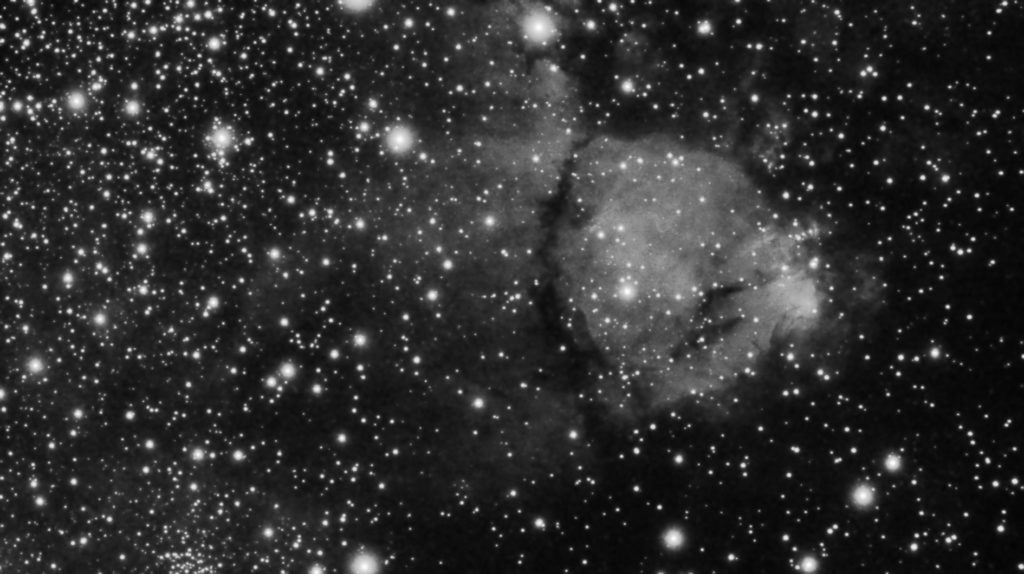
Figure A shows the relative strength of Ha (left) compared to OIII (right). These images were equally “stretched” using Astro Pixel Processor (APP) software. If I were to combine these two into a color image then you would mostly see red with only a few light red regions. You could make the argument that this is how it exists in nature, and you would be correct, but we are striving to show chemical composition, not necessarily quantity:

Figure A

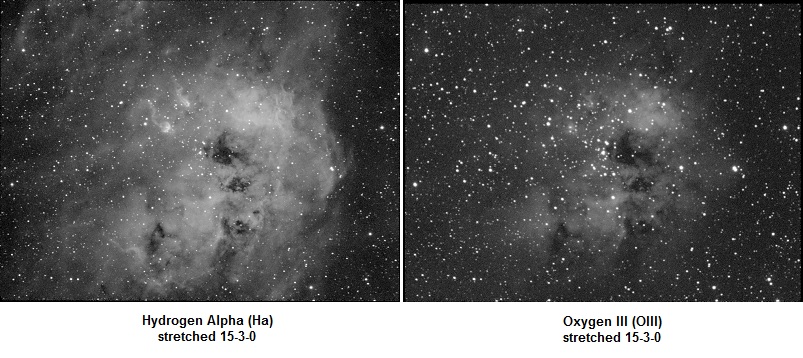
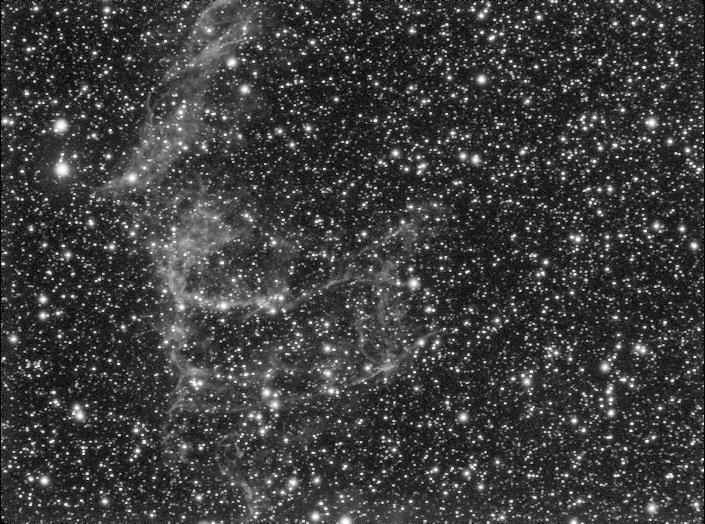
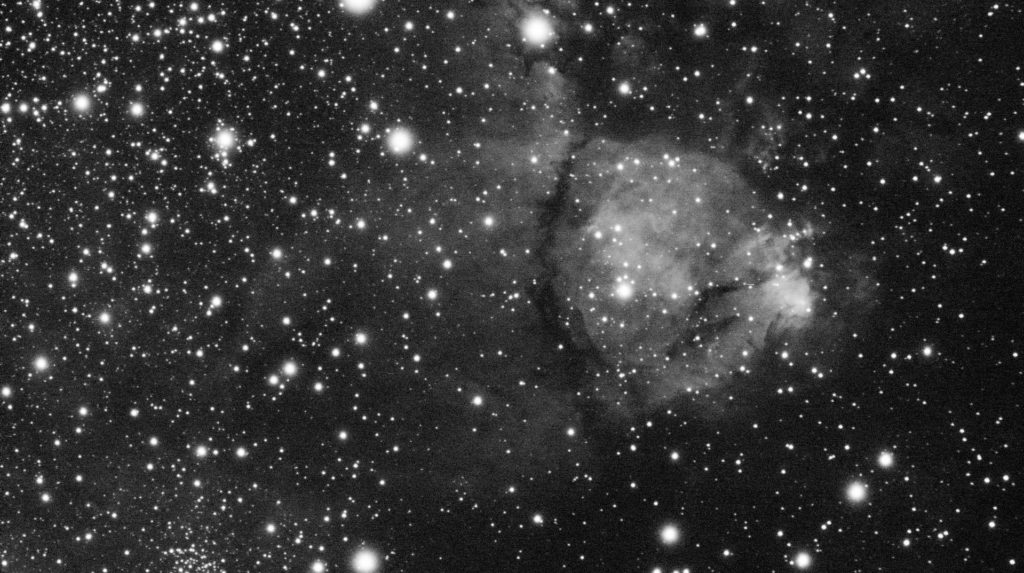
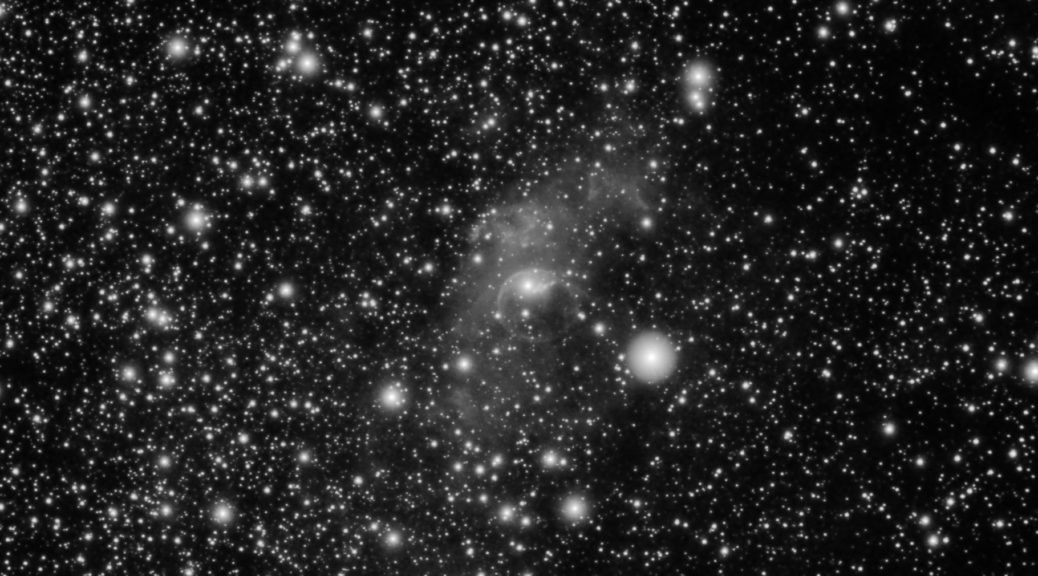
Figure B shows Ha stretched less and OIII stretched more. How much you stretch is a matter of taste. I wanted to come close to Sara Wager’s image.

Figure B

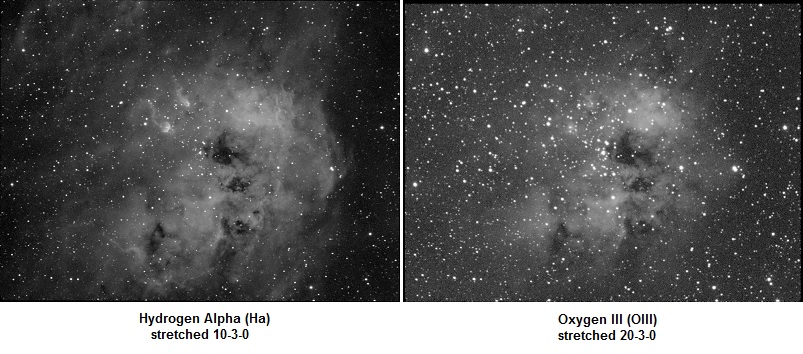
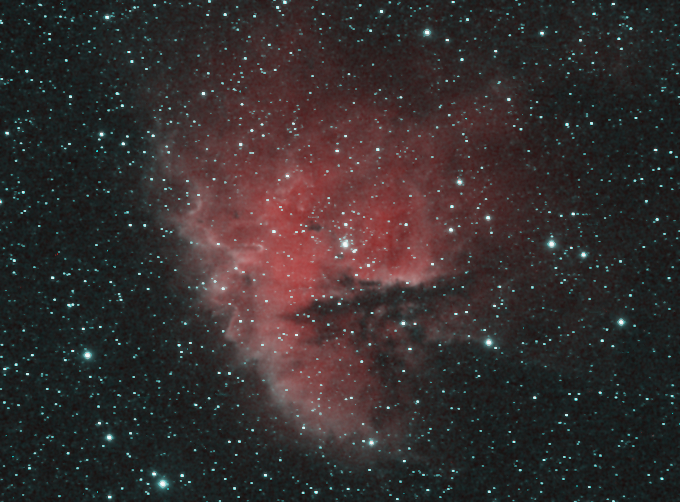
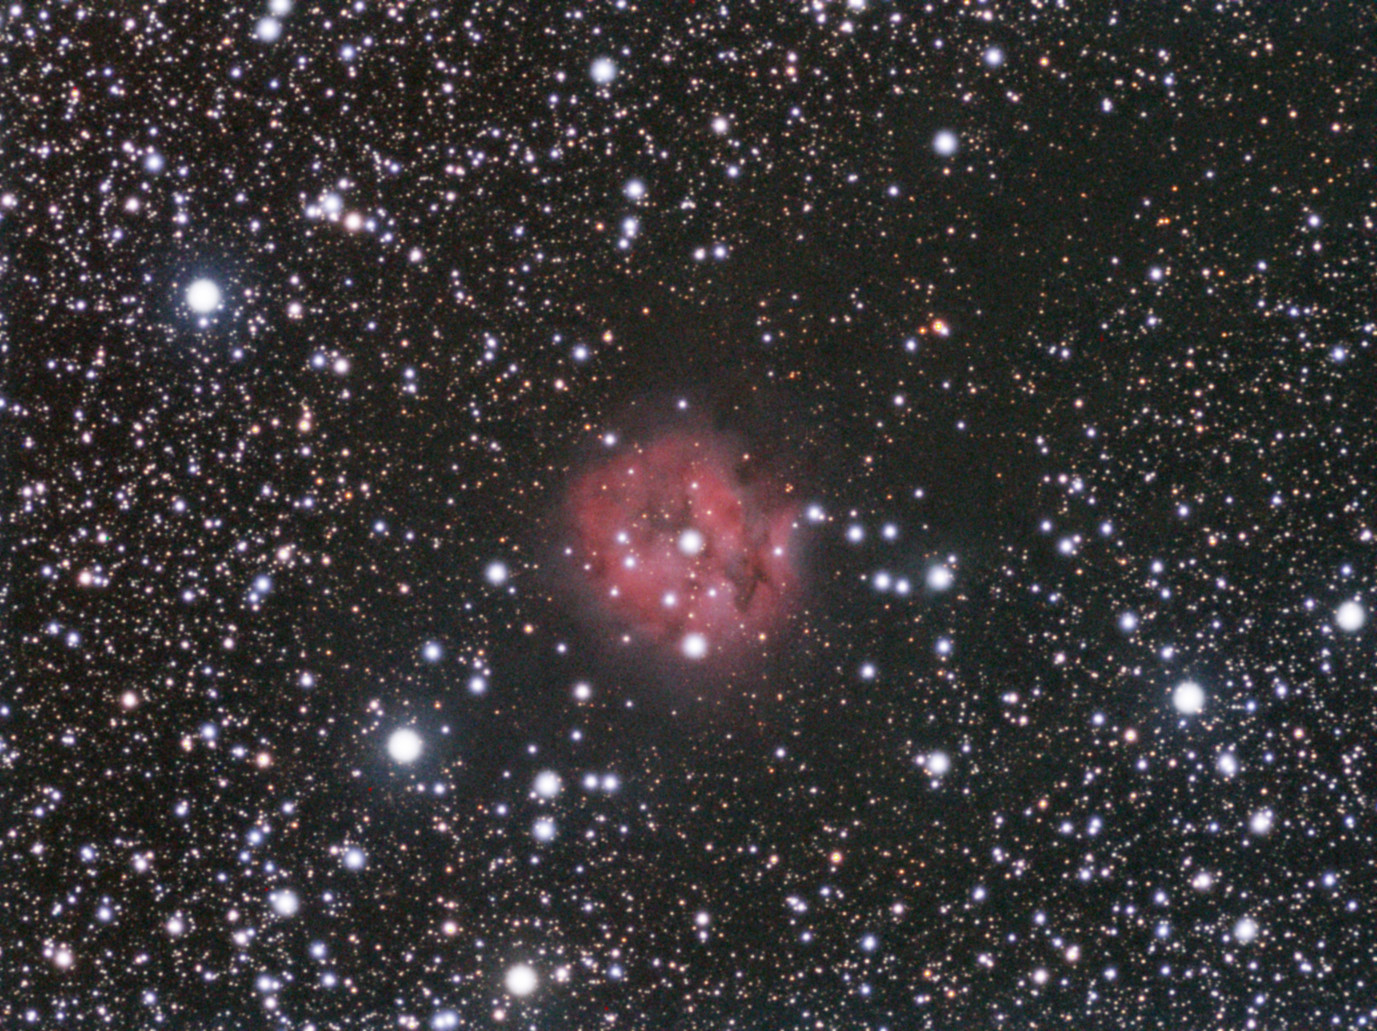
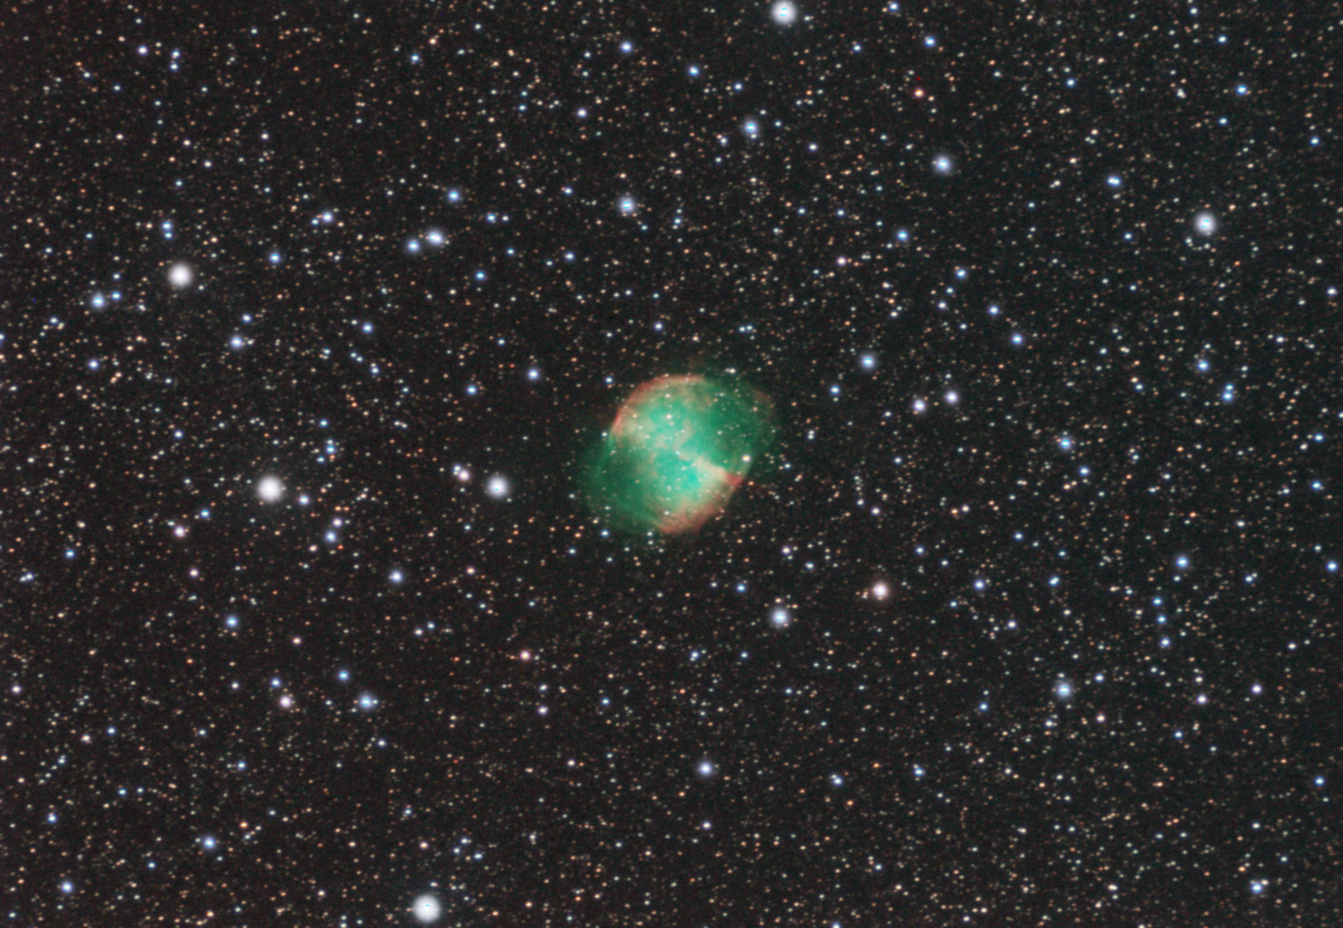
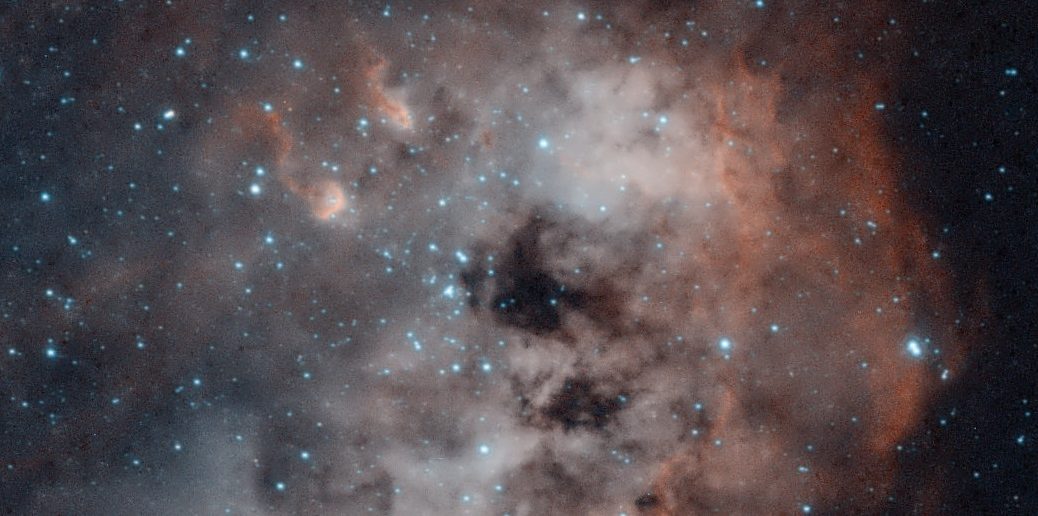
Figure C is the final color image obtained by assigning 85% of Ha to Red, 65% of OIII to Blue, and the remaining amount to Green. This creates a pleasing range of colors:

Figure C

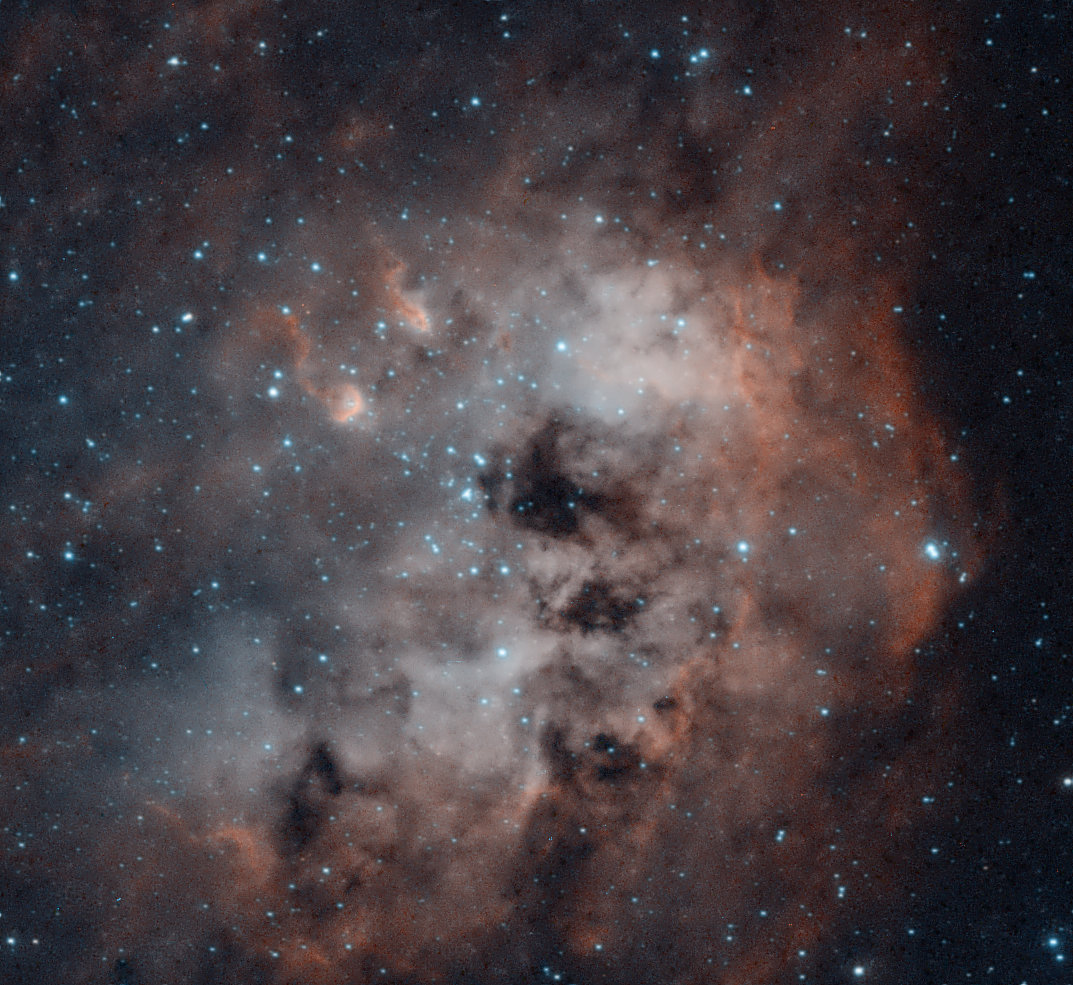
How to interpret the colors:

  • Blue/Cyan on the left side of the image is predominantly oxygen.
  • Scarlet/Orange on the right is almost pure hydrogen.
  • Beige in the center of the nebula is a mix of hydrogen and oxygen.
  • The “tadpoles” have hydrogen tails and oxygen/hydrogen heads.

Here are some other best practices that I learned from Sara Wager:

When combining stacks to create a color image try not to assign a stack to a single channel. For example the “HOO” palette says to assign Ha to Red but if you do that it will render as brilliant red. A more appealing color is scarlet to orange. You can accomplish this by assigning, say, 85% to red and 15% to green.

You need star size reduction software. There are lots of hot blue stars in the sky that strongly emit at the wavelength of OIII. You may have noticed that stars saturate easily in your OIII frames and therefore are fatter than stars in your Ha and SII frames. As a consequence your image will suffer from what I call “oxygen halo”. Also fat stars detract from your subject. Photoshop and PixInsight have tools for reducing star size but they are expensive. StarTools also has a tool. Two years ago I purchased StarTools for $50 for a single license that never expires. It is still available for sale at the same price.

Technical Details:

William Optics 71mm f/5.9
Atik 314E CCD (slightly undersampled at bin1 so bin2 is worse)
Orion 6nm Ha and OIII narrowband filters
Unitron Model 142 German Equatorial Mount.
Tracking: Own design Permanent Periodic Error Correction (PPEC) using stepper motor and Raspberry Pi Model 3B.
Flat-fielder: Own design “The Flatinator”

Image Capture:
Astroberry/INDI/Ekos on Raspberry Pi Model 3B+.
SharpCap for guiding assistance, polar alignment, and PEC learning.
Ha: 18x600s (bin2 to boost signal to keep exposure time to 10 minutes.)
OIII: 23x600s (bin2 also)
Total integration time: 7 hours.

Image Processing:
1. Astro Pixel Processor (APP) for image calibration, integration, stretch, and composition. 2x drizzle to repair square stars and restore image dimensions to bin1.
2. StarTools for star size reduction and additional image processing.

HOO palette:
Ha: Red 85%, Green 15%
OIII: Green 35%, Blue 65% (stretched before combine as shown in Figure B)

What makes the PacMan Nebula light up?

What makes the PacMan Nebula light up?

A former co-worker who has an interest in astronomy prompted me to answer the title question: “What makes it light up?”

To understand what is happening look at a neon sign. It is made up of a tube of neon gas atoms. On both ends of the tube a very, very high electric voltage is applied. The electric energy temporarily strips a neon atom of one of its electrons. A fraction of a second later that electron rejoins the atom and when it does a photon of light is emitted. The wavelength of that light is very “narrow”.

Notice how I used the term “narrowband” in the previous post. What this means is that I use a filter that passes only a narrow band of light. Different atoms emit different wavelengths of light. Hydrogen is different from sulfur which is different from oxygen. By using different filters I can tell which elements make up a cloud of gas in outer space.

The last question to answer is where does the “very, very high electric voltage” come from in outer space? The answer is that it doesn’t have to be an electric voltage, just something that is highly energetic. If you look at the center of the PacMan nebula you will see a bright star and several stars around it. That cluster of stars emits a lot of energy which causes the gaseous nebula to light up somewhat like a neon sign!

The PacMan Nebula is known as an “emission nebula” not to be confused with a “reflection nebula”.

PacMan Bi-Color Ha-SII-SII with only 2 hours of data

PacMan Bi-Color Ha-SII-SII with only 2 hours of data

Having recently broken the sound barrier with improvements to my Raspberry Pi’s tracking software, I am now able to take unguided 8-minute exposures.

I set out to capture the PacMan nebula (NGC 281) in narrowband in order to do a full Hubble Palette but the weather turned ugly so I was only able to capture one hour in Hydrogen-alpha (Ha) and one hour in Sulfur-II (SII). According to forecasts the weather won’t improve for at least a week.

Here is what I have. I don’t think it is too bad considering that top-tier images in narrowband have at least 10-20 hours of data compared to my 2 hours. Another negative going against me is that my f/5.9 refractor is a bit too slow for this type of work, and my Atik 314E is not at all sensitive to the red part of the light spectrum. This is why I image in bin2 mode. If you zoom in you can see that my stars are square. These deficiencies can be solved in a variety of ways but for now this is what I have.

How to interpret the colors? By in large this is a hydrogen gas cloud with hints of sulfur (and oxygen that I haven’t captured yet) but it is predominantly hydrogen. The dark red areas are almost 100% hydrogen, the lighter red to nearly gray is sulfur plus hydrogen.

Ha is assigned to the red channel, SII is split 50% to green, 50% to blue, and then SII is boosted 2x. The 2x boosting allows SII to play a prominent role but boosting also means doubling the noise. In the future I will plan on capturing two to four times more SII frames.

For perspective here is the Ha stack:

and here is the SII stack:

when those two are combined you get the color image above.

If you zoom in on the SII image you may notice that the stars are elongated whereas the stars in the Ha image are nearly perfect. The reason is that the atmosphere was particularly turbulent during the hour I captured the SII frames. The ambient temperature dropped at a high rate of 2 degrees Celsius per hour. Thank you to Dr. William G. Unruh, Professor of Physics & Astronomy at University of British Columbia for pointing that out.

Eastern Veil Mosaic

Eastern Veil Mosaic

Astro Pixel Processor (APP) has a powerful tool for creating mosaics. Last night I tested it out. The result is stunning:

My camera has a small field-of-view. It cannot fit the entire nebula in one shot. It must be broken up into two panels. Here is a screenshot of my planetarium software C2A. I used it to plan where to position the telescope. The two overlapping red rectangles indicate the framing. As shown there must be some overlap in order for APP to do its magic:

Each panel consists of 50 individual images using a 73-second exposure. The first step in creating the mosaic is to stack those 50 images to create the upper panel:

Followed by the lower panel:

By the way you may have noticed when you enlarge each image that the stars look square. That was due to the choice I made to capture each image using 2×2 binning, essentially reducing each 2×2 matrix of pixels to one pixel. I did that to boost the signal-to-noise ratio at the cost of resolution. The luminance filter was used for all images, no narrowband.

This summer and fall I plan to create a 15-panel color mosaic of the Andromeda Galaxy.

Cocoon Nebula in LRVB

Cocoon Nebula in LRVB

The Cocoon Nebula lies in the constellation Cygnus in one of the nearby arms of our Milky Way galaxy. In the distant past the nebula gave birth to a cluster of highly energetic stars. The energy from those stars ionize the hydrogen gas, causing it to glow red. The technical classification of this nebula is IC 5146, a bright emission nebula, but there is another nebula, a dark nebula named Barnard 168. You can see hints of it immediately surrounding IC 5146, a region relatively devoid of stars that extend to the upper right-hand corner of the frame. In fact this dark nebula extends a great distance from what you see here. Do an internet search of “Cocoon Nebula” to see wide-field images that show it. If you live atop a mountain or somewhere with exceptionally clear skies away from city lights, dark nebulae can be seen as smokey gray regions.

This was an experiment that fortunately succeeded. I say fortunately because it enables me to practice both astrophotography and photometry using only four filters instead of the usual six. Normally astrophotography requires four filters: luminance, red, green, and blue (LRGB for short). Photometry requires a minimum of two filters: “V” and “B”.

My filter wheel has only five slots. So how did I fit six filters into five slots? I didn’t. I simply replaced the G and B filters with the photometric V and B. I call it LRVB instead of LRGB.

The photometric V filter looks green when you hold it up to light and the B filter looks blue. I knew for a fact that I needed to “white balance” them in order to determine the proper exposure for each. I performed that task last week. I thought it would end there but I was mistaken.

When the time finally came to process all of the images I was disappointed. The colors were muddy looking. What was the problem? The answer lies in the dissimilar spectral response of the filters. The traditional G filter passes light between 500nm and 600nm whereas the photometric V filter passes light between 475nm and 650nm. So the V filter passes some light into what is traditionally the blue and red bands! Furthermore the photometric B filter is slow to pick up light in the blue band but is aggressive in deep blue to ultraviolet.

The solution was found in AstroPixelProcessor (APP) which provides a tool to combine the individual LRVB stacks into a single color composite image. Originally I told APP to assign 100% of the V-stack to the green channel but that resulted in muddy colors. This time I told it to assign 75% to the green channel and 25% to the blue channel. That was the solution!

The technical details

William Optics 71mm f/5.9
Atik 314E CCD (cooled but not set-point)
Optolong Luminance and Red filters
Astrodon Photometric V and B filters
Unitron Model 142 German Equatorial Mount.
Tracking: Own design Permanent Periodic Error Correction (PPEC) using stepper motor and Raspberry Pi Model 3B.
Flat-fielder: Own design “The Flatinator”

Exposure:
Luminance (binning 1×1): 70x 60s using Optolong Luminance filter
Red (binning 2×2): 70x 73s using Optolong Red filter
Green (binning 2×2): 70x 45s using Astrodon Photometric V filter
Blue (binning 2×2): 70x 92s using Astrodon Photometric B filter

Flats: 50 each filter
Darks: 50 each filter
Bias: 100x 1ms

Total Integration Time: 5.25 hours

Captured with Astroberry/INDI/Ekos on Raspberry Pi Model 3B+.
Processed in Astro Pixel Processor (APP) and GIMP.
White Balancing using a method described by Al Kelly: “White Balancing RGB Filters with a G2V Star”

Bortle 5 site
Transparency: Average
Seeing: Average

M27 Dumbbell Nebula with Atik 314E CCD

M27 Dumbbell Nebula with Atik 314E CCD

M27_2019-06-04_BMorgan(c)

The Dumbbell Nebula was discovered in 1764 by famed French astronomer and comet hunter Charles Messier. It is the 27th object in his eponymous catalog, better known as M27.

The hot central star, which can be seen in this image, is in one of its last evolutionary stages. The gases were ejected about 9,800 years ago based on the expansion rate determined by a group of researchers in 1970.

The intense ultraviolet radiation from the central star causes the gas atoms of the nebula to emit light in the visible spectrum. The color of the light is significant. Red indicates hydrogen and green indicates oxygen. M27 is known as an emission nebula for that reason. Another type of nebula is a reflection nebula which only reflects the light of nearby stars.

The color of ionized oxygen is green in my image. Other photos may show it as bluish-green or cyan. The actual color is in indeed cyan. This discrepancy has to do with my camera’s filters. There are many decisions when purchasing filters, chief among them is how they handle ionized oxygen, so-called OIII regions at 501nm wavelength. OIII is right at the dividing line between the green and blue filters. My green filter passes nearly all of the OIII light; relatively little passes through the blue filter. Other manufacturers design their filters to pass equal amounts of OIII in both the green and blue filters, giving you cyan. This highlights the challenges of properly imaging emission nebulae. All other colors are accurate, including star colors.

This image is the first done with my new $400 CCD camera: Atik 314E. It is “new” to me but the camera is actually 10 years old. This is an outstanding price for a quality CCD camera. You can easily spend $2,000 or more for newer CCD cameras.

CCD image quality is superior to CMOS in my opinion. The more experience I gain in astrophotography the more convinced I am that one size does not fit all. Before anything you must answer the question: what is my goal? If your answer is lunar and planetary imaging then CMOS is right for you. If your answer is deep-sky, like nebulae and galaxies, then CCD is the choice.

One closing remark about my image: you may have noticed a faint reddish cast to the leftmost two-thirds of the image. This is not light pollution. It is the Milky Way.

Here are the technical details for those who would like to duplicate my results:

William Optics 71mm f/5.9
Atik 314E CCD (cooled but not set-point)
Optolong LRGB filters
Unitron Model 142 German Equatorial Mount (GEM) — 50 years old.
Tracking: Own design Periodic Error Correction (PEC) using stepper motor and Raspberry Pi.
Flat-fielder: Own design “The Flatinator”

Exposure:
Luminance (binning 1×1): 30x 60s
Red (binning 2×2): 30x 73s
Green (binning 2×2): 30x 45s
Blue (binning 2×2): 30x 61s

Flats: 50 each filter
Darks: 50 each filter
Bias (1×1): 100x 1ms
Bias (2×2): 100x 1ms

Total Integration Time: 120m

Captured with INDI/Ekos running on Raspberry Pi.
Processed in Astro Pixel Processor (APP) and GIMP.
White Balancing using a method described by Al Kelly: “White Balancing RGB Filters with a G2V Star”

Bortle 5 site
Transparency: Above Average
Seeing: Average

NGC 896 – Fish Head Nebula

NGC 896 – Fish Head Nebula

Acquisition Date: September 7, 2018

I am not sure if Fish Head Nebula is official but people do refer to it as such. It is part of the Heart Nebula but it has a different NGC designation.

Technical Details:

William Optics 71mm f/5.9
Altair 290M camera (uncooled)
Optolong luminance filter
Unitron Model 142 GEM
Passive tracking with PEC
No active guiding

Gain 100 (FWD: 15ke-, 3.66 e-/ADU)
Offset: 20 ADU
Exposure: 50s
Camera rotation: 3.8 deg E of N

Luminance:
69.0 degF: 8 frames
69.5 degF: 54 frames
70.0 degF: 26 frames
70.5 degF: 12 frames
Darks:
69.0 degF: 269 frames
69.5 degF: 141 frames
70.0 degF: 86 frames
70.5 degF: 113 frames
Flats: 100
Bias: 100
Total integration time: 66 minutes (it really needs more time)

SharpCap 3.1.5219
PIPP 2.5.9
Deep Sky Stacker 3.3.2
StarTools 1.3.5.289

Update:

In these past couple weeks I’ve transitioned away from using Deep Sky Stacker and StarTools to using Astro Pixel Processor (APP). Here is a comparison of the two.

Deep Sky Stacker and StarTools:

Fish Head Nebula

Astro Pixel Processor (APP):

NGC 896

I like the APP image better. I am hoping that APP’s developer (Mabula) is working on noise reduction controls.

This summer I plan on re-imaging this object using Gain 200 instead of Gain 100. I have reason to believe that the bright stars will be less ‘fat’ since this bothers me. Recently I’ve experimented with Gain 200 and found that it greatly improves stars and reduces noise. The trade-off is that it lowers my full well depth from 15,000 electrons to 7,500 electrons. It will be an interesting experiment!

NGC 7635 – Bubble Nebula

NGC 7635 – Bubble Nebula

Acquisition Date: September 7, 2018

I really do like my uncooled Altair 290M camera but one thing is missing: a sensor temperature readout. This has stood in my way of creating a Darks Library. Having a Darks Library would free up my time to concentrate on capturing Light frames.

There is nothing worse than having to waste an hour collecting darks under the stars. Furthermore, I committed the sin of collecting darks after my lights when the temperature was usually much cooler (if anything, you should collect them before.) So I was getting sub-optimal noisy images with the hint of raining noise when the temperature of my darks were very different than my lights.

I decided to do something about it. I built a Temperature Logger with an Arduino, a high-precision temperature sensor having an accuracy of 0.25C, an SD card reader/writer, and a LIPO battery. I position the unit near my telescope. It records ambient temperature once per minute and writes it with a timestamp to the SD card. I’ve had it running for 11 hours straight on a single charge. It could probably go longer.

On those cloudy nights I collect darks. Then the following morning I download the image files and the temperature log, and segregate the image files by temperature. These past couple nights the weather cleared to try it all out. I like the results. Smoother, less noisy prints with no hint of raining noise.

Technical Details:

William Optics 71mm f/5.9
Altair 290M camera (uncooled)
Optolong luminance filter
Unitron Model 142 GEM
Passive tracking with PEC
No active guiding

Gain 100 (FWD: 15ke-, 3.66 e-/ADU)
Offset: 20 ADU
Exposure: 50s
Camera rotation: 3.8 deg E of N

Captured over 2 nights:
Luminance:
70.5 degF: 1 frame
71.0 degF: 22 frames
71.5 degF: 48 frames
72.0 degF: 4 frames
72.5 degF: 69 frames
Darks:
70.5 degF: 113 frames
71.0 degF: 69 frames
71.5 degF: 94 frames
72.0 degF: 96 frames
72.5 degF: 96 frames
Flats: 100
Bias: 100
Total integration time: 83 minutes

SharpCap 3.1.5219
PIPP 2.5.9
Deep Sky Stacker 3.3.2
StarTools 1.3.5.289

Soul Nebula in Ha

Soul Nebula in Ha

Acquisition Date: September 30, 2018

The inspiration for this image came from Sara Wager — an incredible, creamy smooth color image using three narrowband filters and over 37 hours total integration time. My equipment doesn’t come close to hers but I wanted to give it a try.

Due to a spate of bad weather I could only manage one clear night to image in Hydrogen-Alpha (Ha). That explains why my image is black & white and Sara’s is color.

Another obvious difference is that my image is ‘noisier’. The primary reason is that Sara’s camera is cooled and mine is not. Images from cooled cameras suffer less from thermal noise. Finally, she’s got 37 hours of integration time and I’ve got 2 hours. Noise tends to cancel with increased time due to its random nature

Technical Details:

William Optics 71mm f/5.9
Altair 290M camera (uncooled)
Orion 6nm Hydrogen Alpha filter
Unitron Model 142 GEM
Passive tracking with PEC
No active guiding

Gain 389 (1.0 e-/ADU, FWD: 4ke-, Read Noise: 1.38e-)
Offset: 30 ADU
Exposure: 200s
Camera rotation: 355 deg E of N

Ha:
48.0 degF: 8 frames
48.5 degF: 21 frames
49.0 degF: 11 frames
49.5 degF: 1 frames
Darks:
48.0 degF: 20 frames
48.5 degF: 21 frames
49.0 degF: 32 frames
49.5 degF: 29 frames
Flats: 50
Bias: 100
Temperature-matching disabled until I have more darks per temperature bucket.
Total integration time: 136 minutes

75% waning gibbous Moon high in the sky

SharpCap 3.1.5219
PIPP 2.5.9
Deep Sky Stacker 3.3.2
StarTools 1.3.5.289