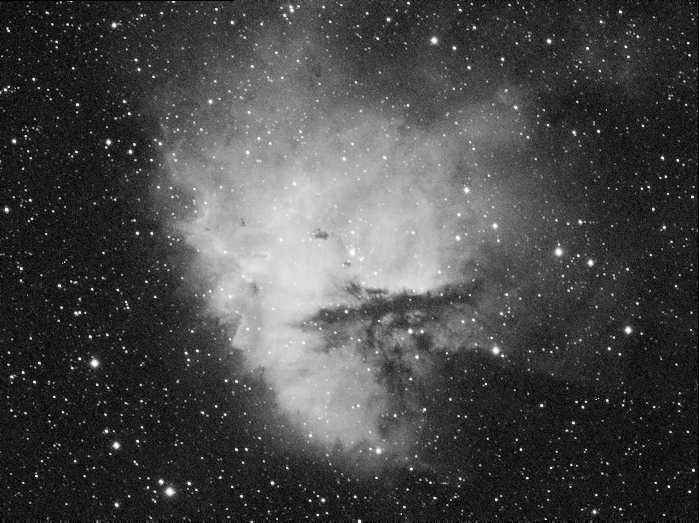
What makes the PacMan Nebula light up?
A former co-worker who has an interest in astronomy prompted me to answer the title question: “What makes it light up?”
To understand what is happening look at a neon sign. It is made up of a tube of neon gas atoms. On both ends of the tube a very, very high electric voltage is applied. The electric energy temporarily strips a neon atom of one of its electrons. A fraction of a second later that electron rejoins the atom and when it does a photon of light is emitted. The wavelength of that light is very “narrow”.
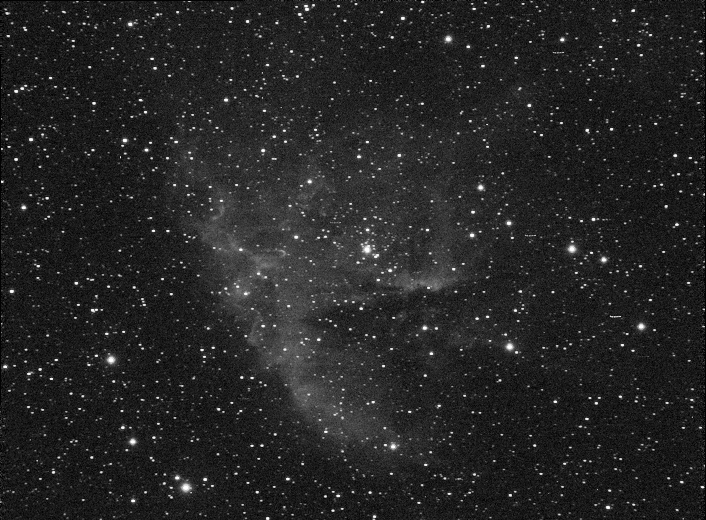
Notice how I used the term “narrowband” in the previous post. What this means is that I use a filter that passes only a narrow band of light. Different atoms emit different wavelengths of light. Hydrogen is different from sulfur which is different from oxygen. By using different filters I can tell which elements make up a cloud of gas in outer space.
The last question to answer is where does the “very, very high electric voltage” come from in outer space? The answer is that it doesn’t have to be an electric voltage, just something that is highly energetic. If you look at the center of the PacMan nebula you will see a bright star and several stars around it. That cluster of stars emits a lot of energy which causes the gaseous nebula to light up somewhat like a neon sign!
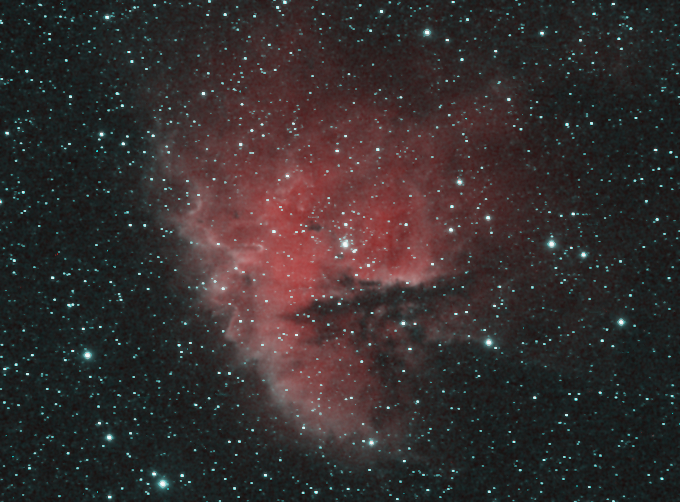
The PacMan Nebula is known as an “emission nebula” not to be confused with a “reflection nebula”.