Eclipsing Binary Star System: GK Boo (Part 2)
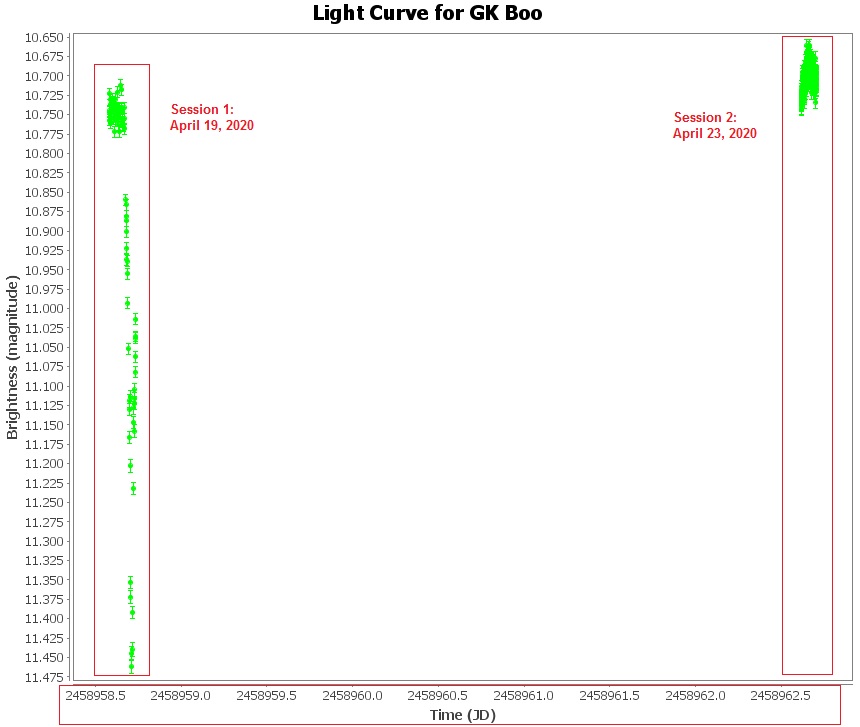
The data that I presented in Part 1 was from a single session on April 23, 2020 however I also captured data on April 19, 2020 but unfortunately it suffered from poor tracking. Nevertheless it is still useful for demonstration purposes.
Before I present the second data set allow me to briefly describe the software I use:
AstroImageJ, henceforth referred to as AIJ, enables me to calibrate and align frames (and stack if I so wish.) More importantly I can perform Differential Photometry. The one drawback from my perspective is that it is designed for Exoplanet research and therefore expects me to capture the entire light curve in a single session, however my requirements differ in that the period of most variable stars far exceeds that.
VStar, a Java application from AAVSO, enables me to view my data over multiple sessions. Using it I can switch between two modes: Light Curve and Phase Plot. Light Curve mode is similar to AIJ in which the horizontal axis is in units of time. Phase Plot mode requires me to know something about the period of the light curve. It takes that information and then “folds” my observations onto a phase scale from -100% to +100%.
In the following screenshot I used VStar to plot the two sessions in Light Curve mode. Notice how the data is compressed horizontally. This is due to the fact that four days separated the first and second session:

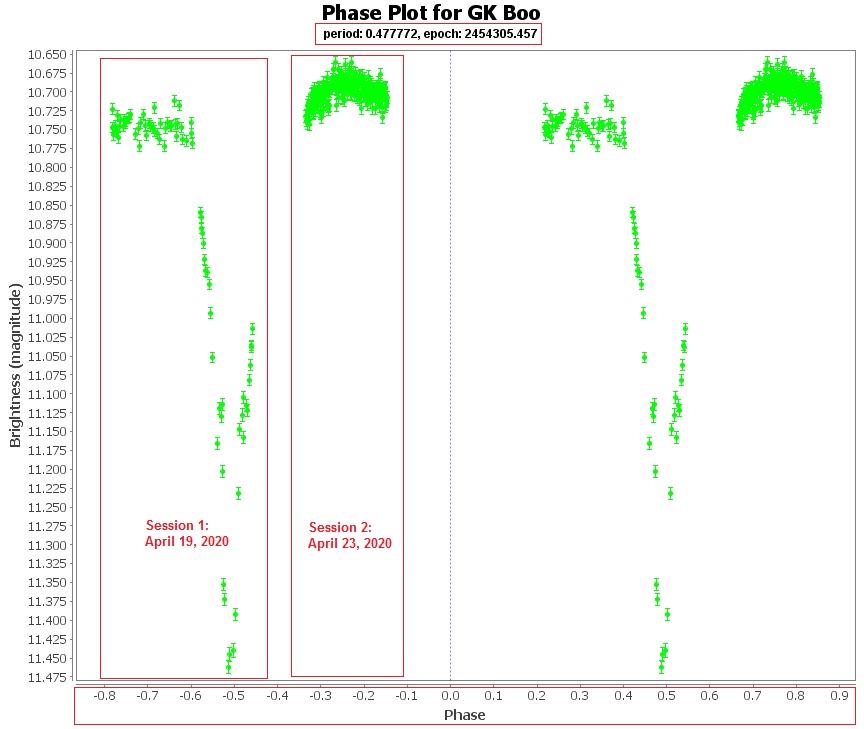
This next screenshot uses VStar’s Phase Plot mode. I entered GK Boo’s period obtained from the AAVSO database:

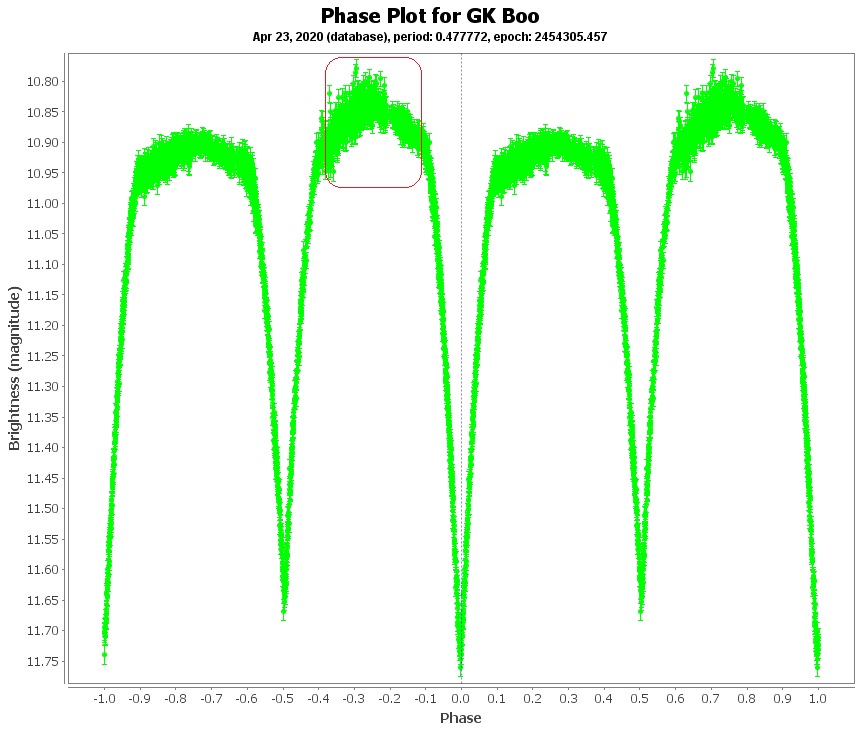
Compare the Phase Plot of my data to that of all data from members of AAVSO, seen below. (Please ignore the red box drawn atop one of the peaks. This image is being shared from an earlier post.) Notice the similarity:

Phase Plot mode is essential since some variable stars take a year or more to capture and can span dozens of sessions.